In my last larger gig I worked on fascinating project - Postgres connection pooler written in Elixir. Unfortunately, due to different circumstances, this project burned me out to the ground. However what doesn't kill you is crap not a weapon can become great learning experience.
Most of my achievements in this project were related to performance. This project contains very tight loop in form of query handler, that needed to run hundreds of thousands times per second per user connection. That mean that this functions are very sensitive to even slightest performance changes. And that was my task - to find potential improvements that can be made to make this codebase be much faster.
After departing from Supabase I liked the project so much (mostly as learning ground) that I have created my own fork. There, unrestrained from all business side of the project I could focus purely on squeezing as much of performance as I can. This project now lives as Ultravisor - it is still nowhere near being done in a way that I like, but I still go back to work on it from time to time to find potential performance improvements.
This is a story of things that I have done and learned during that journey.
Beware: It is retrospection, so in some places my memory may be not the best.
Here I need to provide some explanation first, about how Ultravisor works with database connections. It provides 2 modes of operation:
session- where each connection from user to Ultravisor checks out one connection from Ultravisor to database. It checks out once, at the start of connection, and then holds connection until the end;transaction- where on connection there is nothing done. Client connects to the Ultravisor and can keep that connection indefinitely without ever bothering database. Database connection is checked out only when there is some request from user and is returned to the pool as soon as that result of that query is returned and database is ready for next one.
While session mode is quite on par with other implementations of connection pooling for Postgres, transaction mode is where performance is lacking and is the main focus is put. In whole article (unless mentioned otherwise) I will speak about transaction mode of Ultravisor.
Lesson: Flame graphs and call tracing is essential#
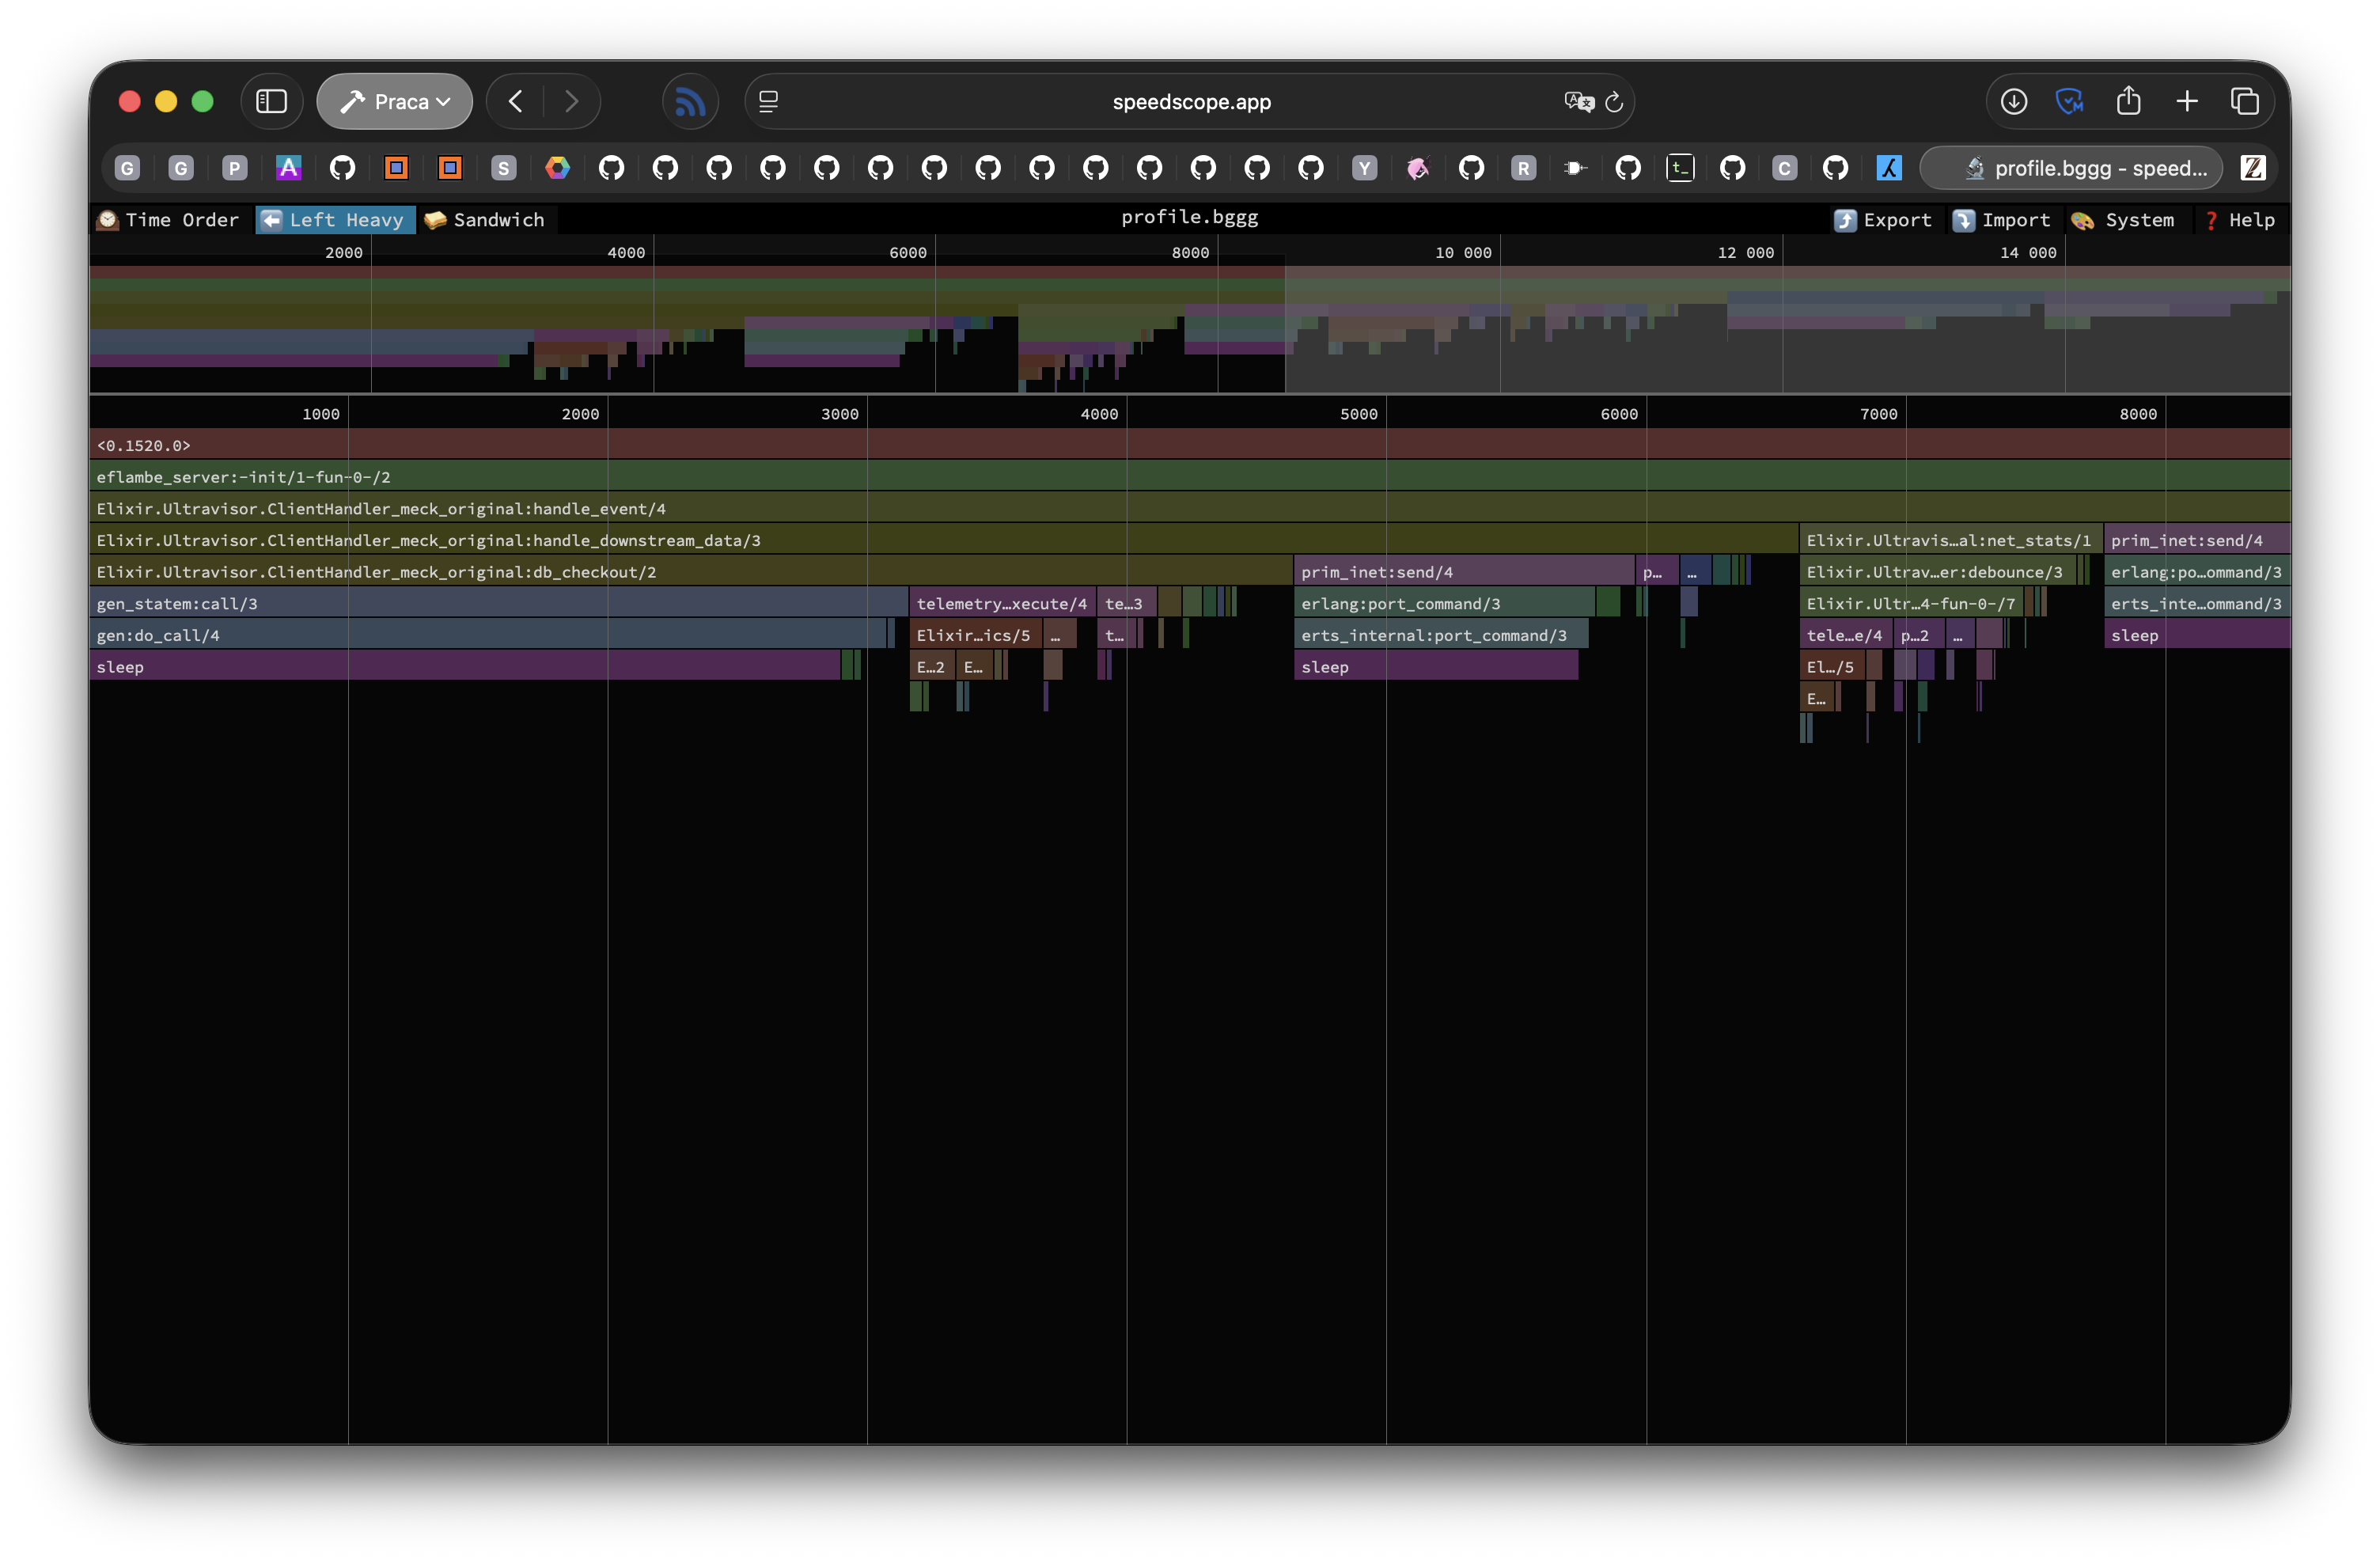
Pretty obvious thing, but still valuable lesson for any performance optimisation endeavour. For that the great thanks to Trevor Brown and his awesome project eFlambè. This helped a lot in tracing hot points in the running code.
Unfortunately this project seems to be less active recently and has some missing features, like listening for given duration instead of function calls count. This can be partially fixed by simply listening for count of calls to handle_event/4 function given times and then running cat *.bggg to concatenate all files into larger trace. That has disadvantages, but at least it was workable within Speedoscope which I also highly recommend to anyone who needs to work on such optimisation.
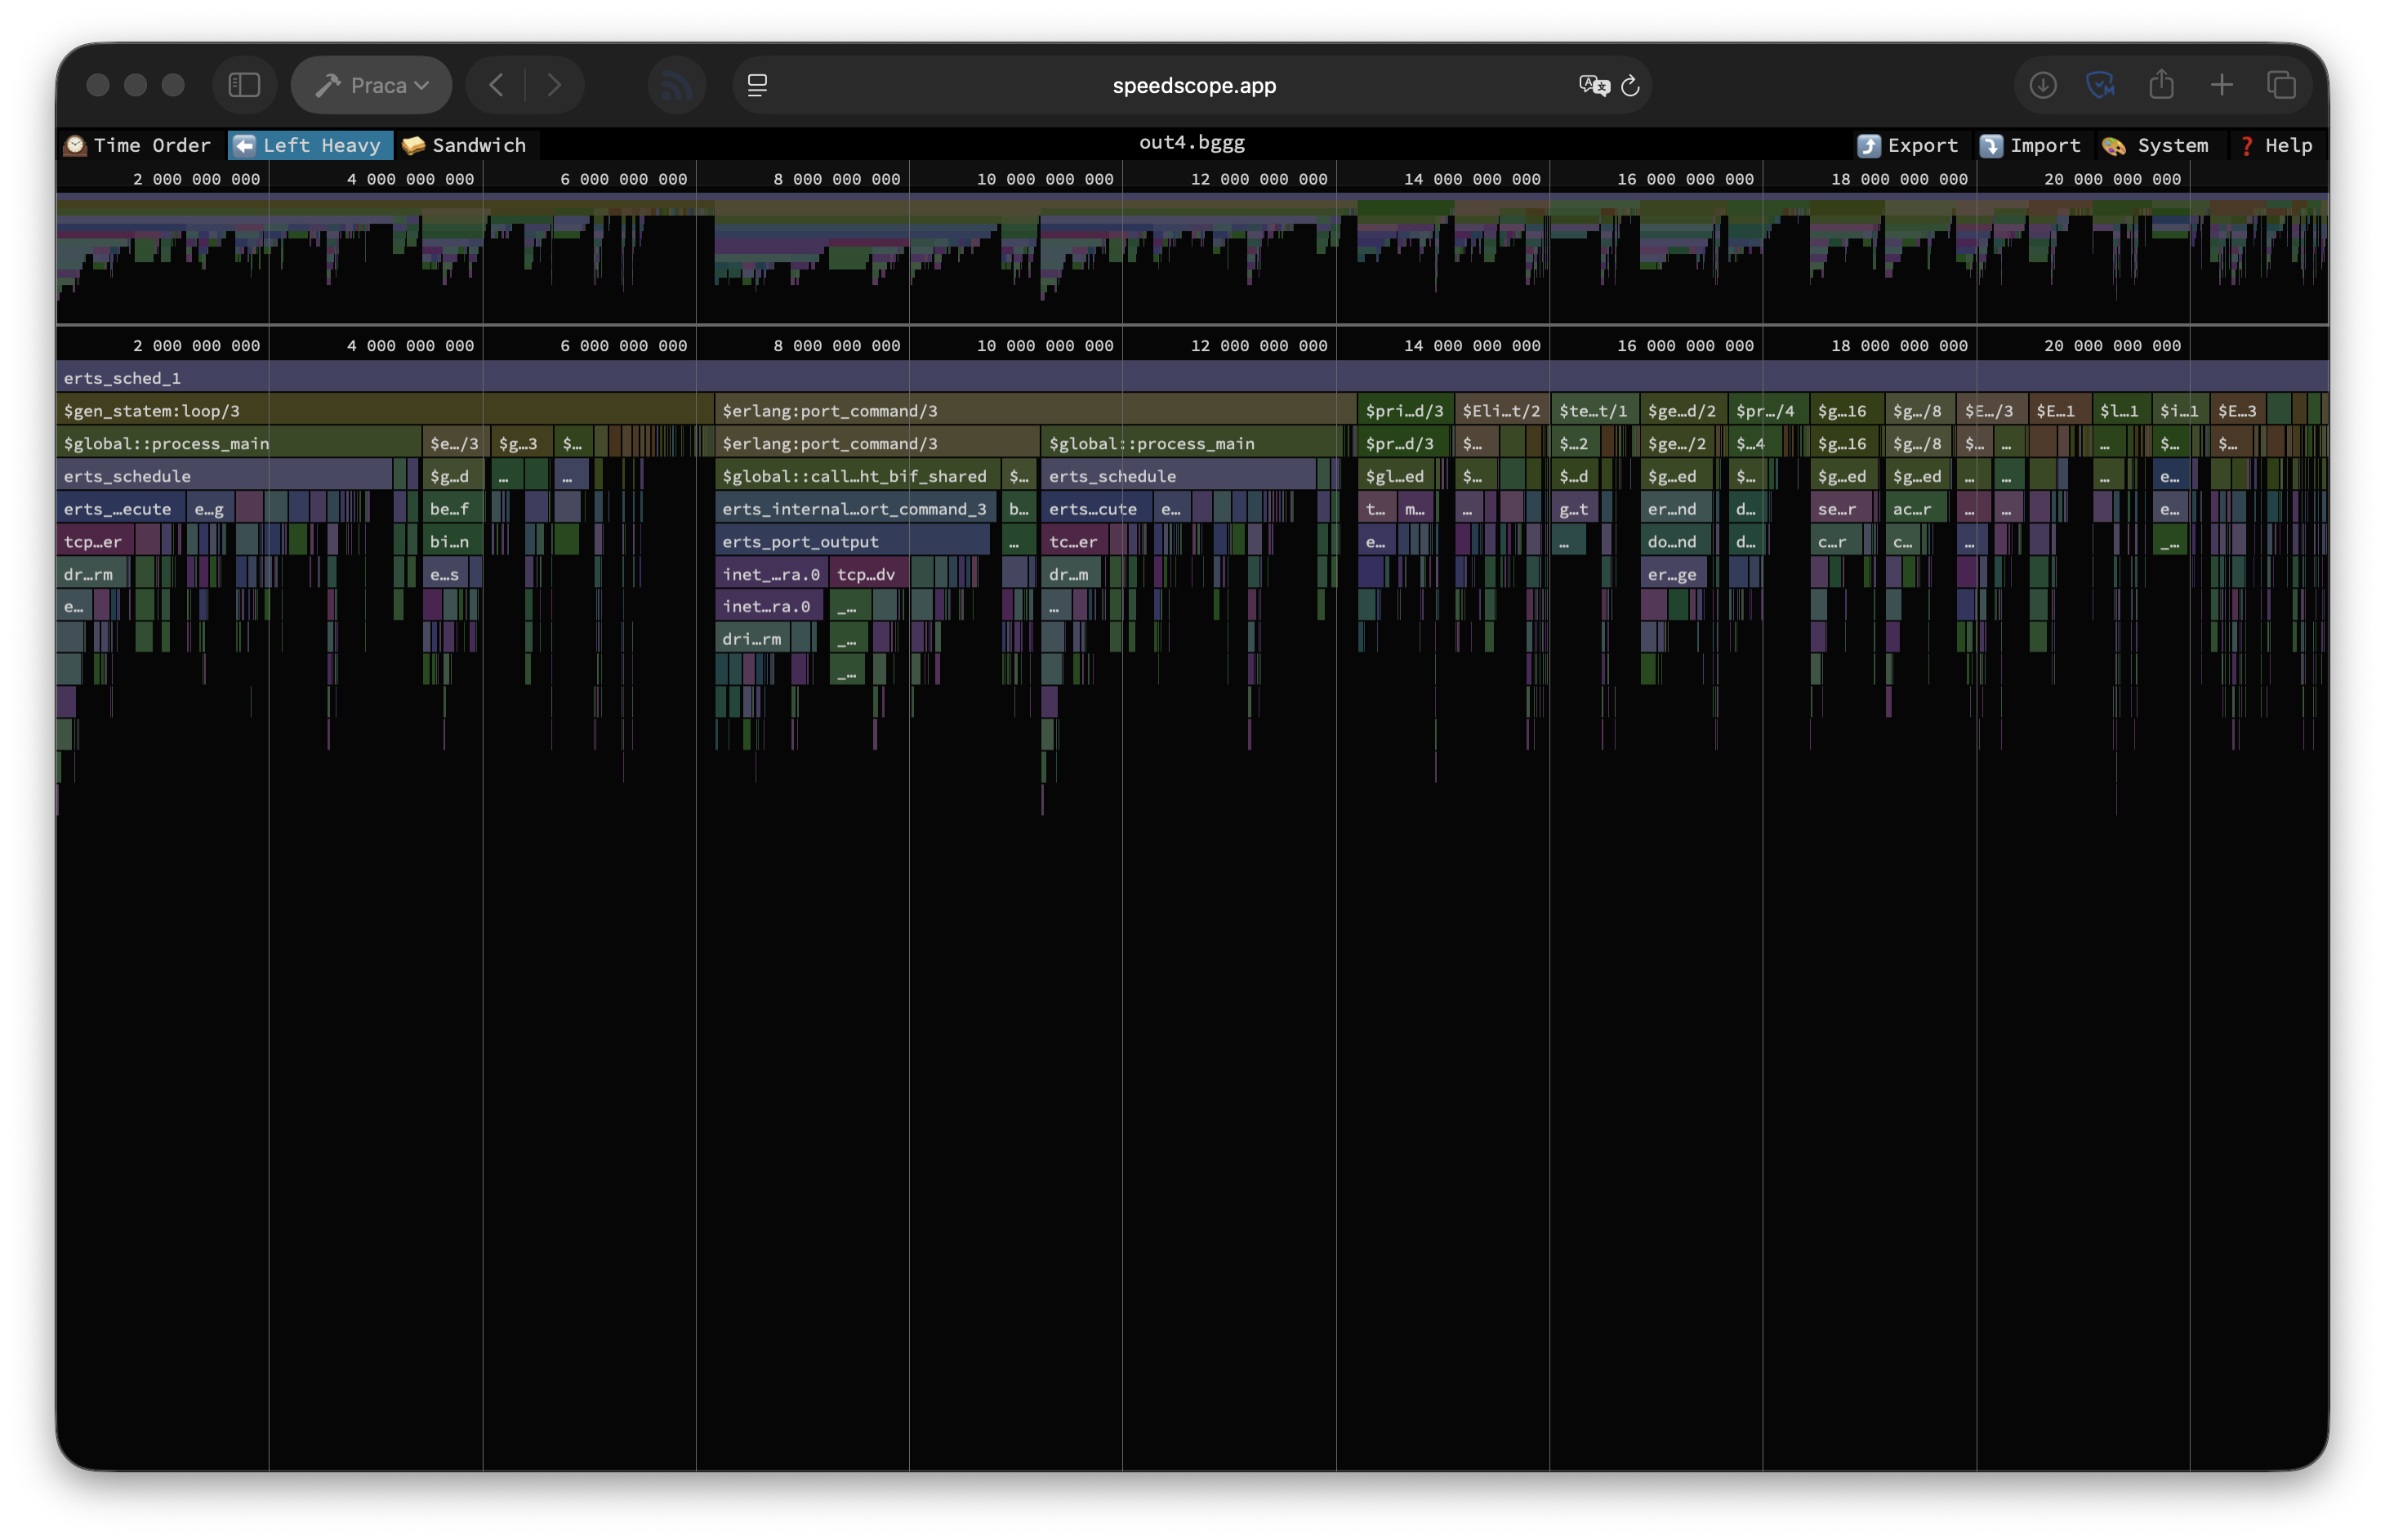
While flame graphs are awesome, there is cost to gathering them with eFlambè - it greatly affects performance. Fortunately Erlang has some built-in tools that have lesser performance impact, and the "most modern" of these is tprof. This tool is pretty easy to use, but is less detailed than eFlambè. But even with that limitation, it provides superb insight into stuff that has greatest impact on performance. It make it easier to work on long running processes, as it work asynchronously, so you can "manually" decide how long you want to trace your process.
Summary: Knowing where your bottlenecks are is essential for performance optimisations.
Lesson: Doing less can improve performance#
Obvious thing that need to be stated - doing nothing is faster than doing something. Extracting amount of data sent over given socket using :inet.getstat/2 call is fast, but not free. That involves some waiting for response from either port or process handling connection, which introduces slowdown. Two possible solutions there are:
- Do not gather that metric at all - sensible, but not feasible, especially when you use that metric to charge your users.
- Gather that data less often.
The approach I have taken there is obviously 2., and the solution is dumb simple - debouncer.
Debouncing is an interesting technique often used in user interfaces where you accept some event, and then for some period you ignore repeated events. The reason for that is that our interfaces may have flaws that send repeated events one after another.
In this case Ultravisor tries to store amount of sent data after each query, but that can get expensive for many short queries. Instead, I have implemented simple per-process debouncer:
defmodule Ultravisor.Debouncer do
  def debounce(key, time \\ 100, func) do
    current = System.monotonic_time(:millisecond)
    key = {:debounce, key}

    case Process.get(key, nil) do
      {prev, ret} when prev + time > current ->
        ret

      _ ->
        ret = func.()
        Process.put(key, {current, ret})
        ret
    end
  end
end
This stores returned data in process dictionary (per-process mutable space with quick access) and if there was no call in given time-period, then we process data again. This is safe way to do so, as :inet.getstat/2 will always return amount of data that socket processed since it started, so data between calls will be accounted.
Before:
tps = 79401.392762 (without initial connection time)After (10ms of debouncing):
tps = 80069.646510 (without initial connection time)After (100ms of debouncing):
tps = 80568.825937 (without initial connection time)Summary: Doing noting is more performant than doing something. Sometimes doing nothing can be quite easy.
Lesson: Telemetry is not free#
When working on most projects, especially Phoenix-based, one can slap :telemetry.execute/3 calls everywhere and notice no performance degradation1. Unfortunately, when you do hundreds of thousands calls a second - that is not a case.
For unaware readers - Telemetry is Erlang event dispatching system for observability events.
In this project the metrics are exposed in Prometheus/OpenMetrics format, which means that there need to be collection system within the application. In BEAM applications the standard way to implement that is to use ETS tables to store recorded values. Fortunately there are libraries to handle that for you, and for the longest time "gold standard" for it was telemetry_prometheus_core library created by Telemetry core team.
While for most projects that library is performant enough (because metrics aren't recorded in tight loops), in case of this project that was not a case. There, metrics gathering is still one of the hottest spots in the codebase, even with all improvements that have been done.
Excerpt from tprof profile:
| Function | Calls count | Per call (μs) | Percentage |
|---|---|---|---|
Peep.EventHandler.store_metrics/5 | 1421911 | 0.13 | 4.21% |
Peep.Storage.Striped.insert_metric/5 | 904852 | 0.26 | 5.11% |
This is with awesome library Peep by Richard Kallos. When using telemetry_prometheus_core it was simply the most expensive thing in whole loop. Just replacing metrics gathering library with Peep gave us about 2x bump in TPS.
Summary: Telemetry handler can matter in tight loops. Fast metrics gathering isn't easy.
Lesson: Records instead of maps or structs#
Elixir uses structs for structured data. That gives a lot nice features wrt. hot code reloads, compilation graph dependencies, and other. However, because structs are maps, there is a cost. Maps have O(log n) access time to the fields, this is how maps are constructed in memory. While smaller maps have slightly different (better in most cases) characteristics, there is strict requirement that you keep your structure with less than 31 fields2 and it still has slight memory overhead. The alternative is to use records. These have better performance characteristic (always constant) irrelevant of the amount of fields at the cost of being slightly more rigid (records are tuple based) and less convenient to use (experience may vary). Additional advantage in my opinion is that it is harder to add incorrect field by using Map module.
Current (OTP 28) limit for small map is 32 keys, but Elixir uses one key for struct name, hence 31 fields is the limit.
Before you will run and change all structs in your system to records, just remember - most of the time the difference doesn't matter - just use structures.
Before:
tps = 81765.266264 (without initial connection time)After:
tps = 82147.855889 (without initial connection time)Summary: Records are super handy when you need to squeeze each bit of performance. It doesn't provide much, but these adds up.
Lesson: ETS tables are super fast, but not always#
ETS is Erlang's built-in module for storing key-value data in mutable way. Like built-in Redis. This structure allows for sharing some data in a way, that is easy to access from different parts of the system. One example of system that is using ETS for storing their information is Telemetry (mentioned above).
While for 99% of the use cases Telemetry will be fast enough, it has some problems with tight loops. Main problem is that it will always copy data from table to the caller process. That mean that it can put high memory pressure on the process that tries to retrieve data.
Fortunately Erlang supports another mechanism for storing globally accessible data - persistent_term. Of course, there is no such thing as "free lunch" so it has substantial disadvantage. It works poorly3 with data that changes often, as removing or changing data in a key will require walk through all processes to copy data from it to processes that may use it into process memory. However, Telemetry handlers should not change a lot, you should just set them once as soon as your system start, and then ideally they will not change ever again.
There is slight optimisation that makes it fast in some cases (single word values, like atoms), but that is not the case there, so we can ignore that.
Before4:
tps = 76914.004685 (without initial connection time)After:
tps = 78479.006634 (without initial connection time)If you wonder why these results are lower than in previous section, it is because test conditions are identical only per section, not cross sections. In this particular case I have run benchmark while collecting metrics (to show difference in persistent_term change) while other are run without metrics to not pollute results.
Summary: persistent_term is awesome and superfast, so if you know that you have some data that will probably never change and will be requested constantly, then it may be good place to store that data.
Lesson: Calling your GenServers is fast, but not 90k times per second fast#
One of the interesting observations that I have spotted is that if there are longer running queries. Ones that send more data over the network than just simple short responses, then the difference between Ultravisor and "state of the art" tools like PgBouncer or PgDog (written in non-managed languages like C and Rust) is much smaller. Obviously it is still there, but it is on par, not substantially off.
I needed to dig more, what can be the cause of such strange behaviour. The reason was found in place where I least expected it - checking out database connection to be used.
Flame graph showed that almost third of the time is spent on checking out database connections. Most of that time is spent in 2 function calls, both of them are internally gen_statem calls and in both most time is spent on sleeping (aka, waiting for reply).
Now, this is hard thing to optimise, as in Elixir there is no mutability (almost, we will get there). This mean that if I want some form of shared queue of processes, then I need to use separate process to keep state of the queue for us, and then do GenServer calls to fetch that state. What I did in such situation? What any unreasonable Elixir developer obsessed with performance would do - NIF5.
I wanted to use ETS there, but for that to work it lacks function like ets:take/2 that would return only one element from the tables with type bag or duplicate_bag. Or any other form of just taking out any (possibly random) element from ETS table in atomic way.
The implementation is rather basic wrapper over VecDeques that allow popping single element from that queue without any message passing. The implementation is very crude, nowhere production ready. It doesn't provide any form of worker restarts or anything, but works quite well as PoC of what is possible.
New queue also provides a way to store additional "metadata" alongside the worker PID. This allows me to store DB connection socket next to connection process, which removes need for additional call to extract that data to pass requests directly to other DB, without copying data between processes.
Before:
tps = 83619.640673 (without initial connection time)After:
tps = 94191.475386 (without initial connection time)Summary: Sometimes one need to get creative to get around platform limitations. This may require some pesky NIFs though.
Conclusions#
Optimising such project was enormous fun and I think that at the current state there is nothing extra that can be done to optimise it more without optimising generated JIT-ed native code or optimising Erlang scheduler.
There are some flags, that affect performance, but as it is currently unclear why these work at all (probably it is related more to the OS scheduler rather than Erlang performance), I left them out of this article for now.
Post Scriptum: Good tooling helps a lot#
Just after I have started that optimisation project after leaving Supabase I started using Jujutsu for version control. That one thing helped me a lot with being able to have separate branches/PRs for each of the changes, while at the same being able to work with mega-merge of them all.
That allows me to profile code with all other noise removed, while still exposing the changes as separate reviewable units. Without that support I would need to decipher what have already been changed and/or removed from the profile.
Additional feature that I heavily used there is "anonymous branching". As when working with JJ I do not need to create new name for each branch that I want to try. It was way easier to implement one idea, then just do jj new @- (which branches off at the commit that is parent of the current one) and just implement alternative idea. I used that constantly to compare ideas and reject failed concepts.